

The solution we created allows for collecting receipts and information about goods stocks (including goods in transit) all done online, and on this basis it provides users with current information (quantity-time graph) about:
- sales of goods – for each commodity and each level of the hierarchy of goods; for each store separately and for each level of store grouping,
- stocks of goods (as above) – quantity, value, goods in transit, shortage of goods indicator (not only when stock=0, but also in situations when goods which are in stock are not being sold, even if, according to history analysis, they should),
- transactions of a given customer.
With this data, one can create specific sets of charts e.g. comparing given goods or assortment groups for specified stores of a particular Regional Manager (of either a region or a distribution center), or comparing specified periods.
The difference between the solution offered by us and a standard data warehouse deals with loading of data online and making it available to users immediately, whereas sales and stock information available online is kept not only in aggregated form, but with distribution throughout the whole day (for the current day and each previous one). Another important advantage of the solution is that reports can be generated simultaneously by hundreds of users in real time – with graphs generated within one second.
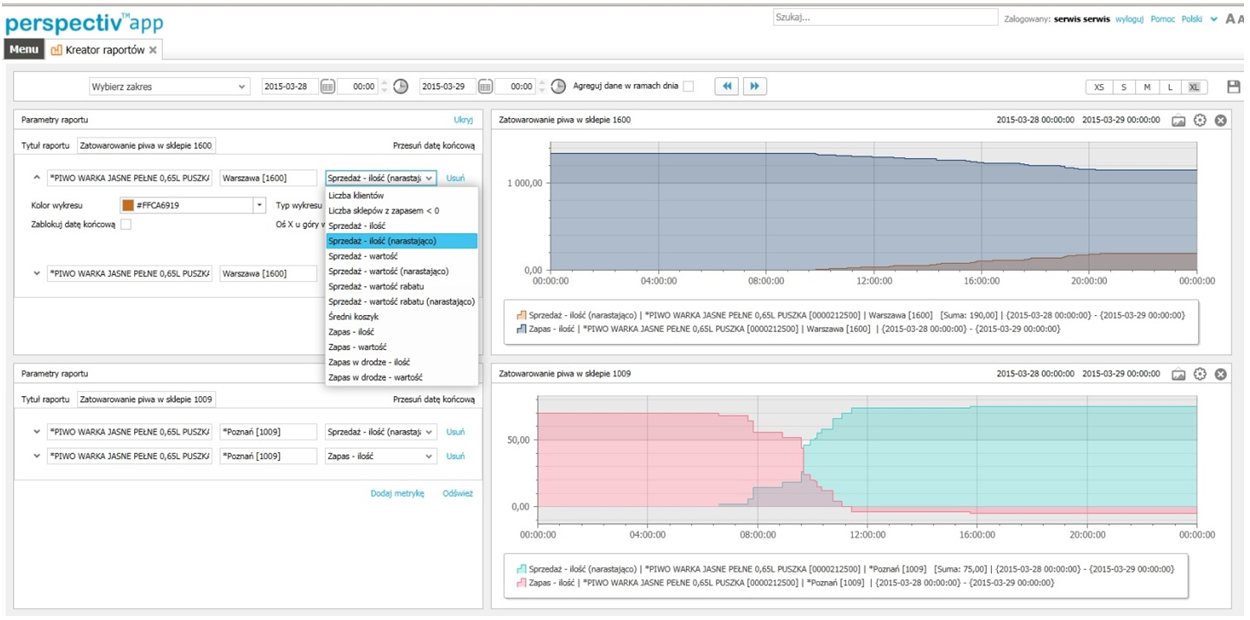 Defining chart parameters
This solution can handle even the largest FMCG retail chains, generating hundreds of receipts per second.
Examples of use:
- analysis of the accuracy of generating orders
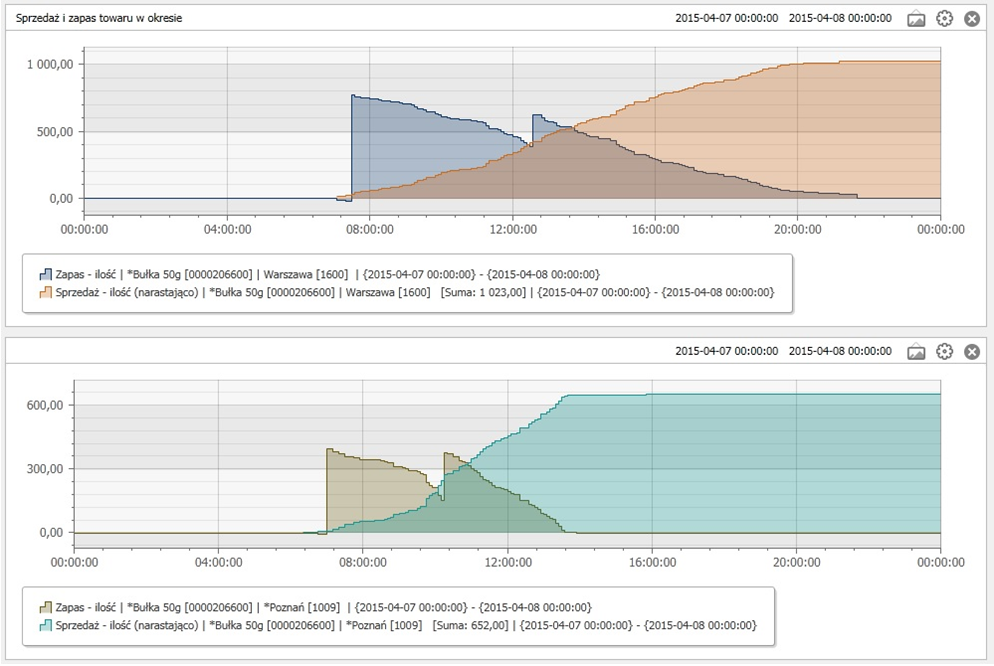
Example: graphs above show sales of the same product on the same day in 2 stores. One can see that in the first store (upper one) orders were optimal - goods (bread rolls) were practically sold out but lasted till the end of the day, whereas in the second store there were not enough goods ordered and the store ran out of them in the middle of the day (around 13:30),
- detecting shortages of goods, estimating lost sales,
- immediate insight into sales and stock chart for the whole chain or selected regions, to allow for quick response - ordering at the supplier or transferring between locations,
- creating desktops for key managers, capable of online display of required information concerning individual regions or the entire chain.
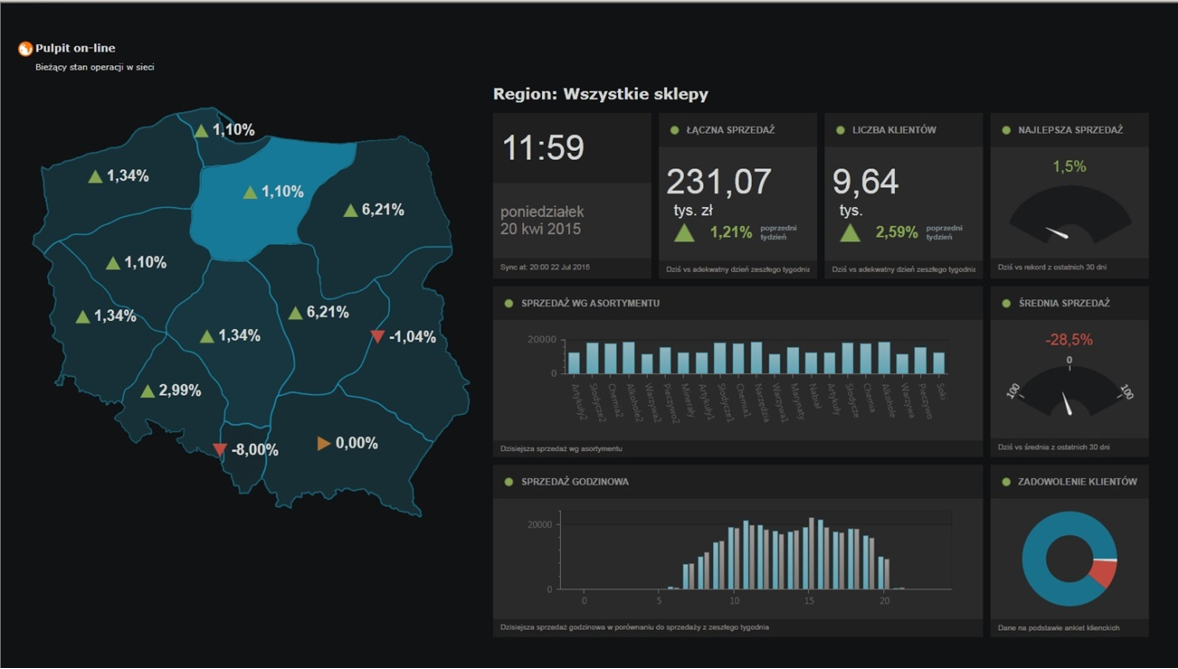 Data presented on the sample desktop